

Hello, fellow data enthusiasts and Google Colab aficionados! Today, we're going to explore how to monitor your Google Colab instances using Netdata. Colab is a fantastic platform for running Notebooks, developing ML models, and other data science and analytics tasks. But have you ever wondered how your Colab instance is performing under the hood? That's where Netdata comes into play!
Why Monitor Your Colab Instance?
While Google Colab provides a convenient and powerful environment for your data science projects, understanding its performance can help you optimize your work and get the most out of the resources at your disposal. By monitoring your Colab instance, you can:
- Identify bottlenecks and performance issues
- Optimize resource usage for faster model training
- Understand how your code impacts system resources
- Ensure you're using Colab efficiently, saving time and effort
So, let's dive into how you can install Netdata on your Google Colab instance and start monitoring!
Installing Netdata on Google Colab
Don't worry the process is super simple and takes less than 2 minutes! Just follow these steps:
Sign up (or log in) to Netdata
Copy the wget command you see on the Connect New Nodes section after logging in
Open your Google Colab notebook and create a new code cell. You can do this by clicking the + Code button.
In the new code cell, paste the wget command you copied earlier. Press Shift + Enter to execute the cell. This will run the Netdata kickstart script, which installs Netdata on your Colab instance.
Finally, create a new code cell and enter
!service netdata restartand press Shift + Enter to execute the cell and restart the Netdata service.
On your Netdata cloud UI you should now see the node representing the Colab instance show upas "Live" and real time metrics getting visualized.
Enjoy Real-time Monitoring of Your Colab Instance
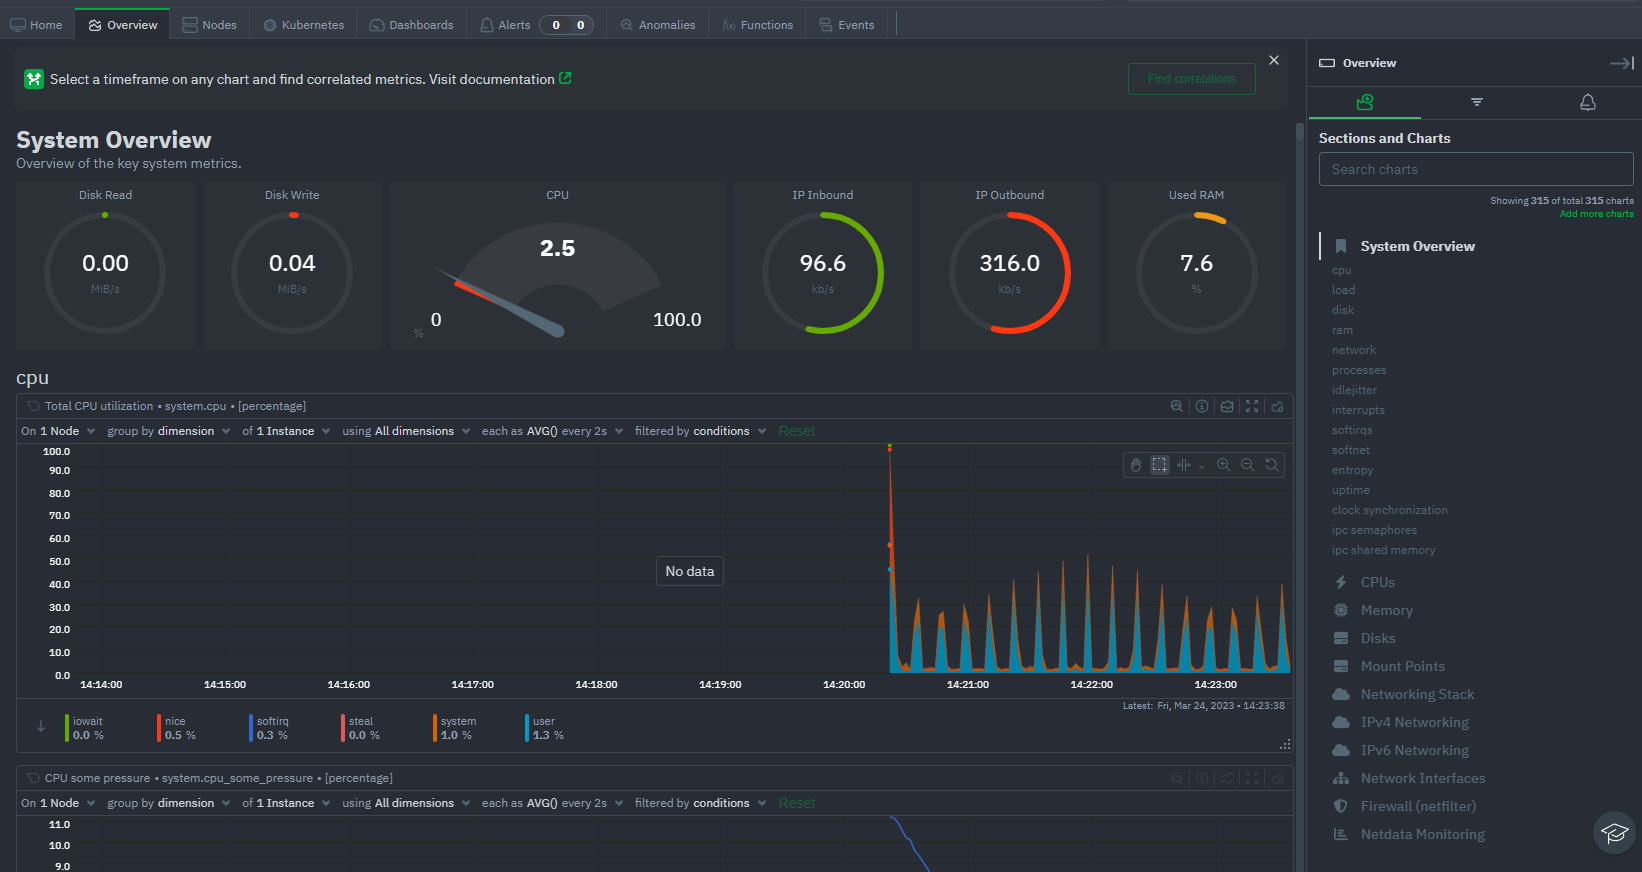
That's it! You've now installed Netdata on your Google Colab instance. With Netdata up and running, you can enjoy real-time monitoring and gain valuable insights into your Colab instance's performance.
So now that everything is setup, what's next? Well there's a lot of possibilies for you to explore. Here's some ideas:
- Monitor resource usage during model training: Monitor CPU, memory, and disk I/O usage during the training of machine learning models. This can help you identify bottlenecks and optimize your model training process.
- Optimize code efficiency: Monitor the impact of code changes on resource consumption to identify inefficient code sections and improve the overall efficiency of your project.
- Detect memory leaks: Keep an eye on memory usage trends over time to detect potential memory leaks in your code.
- Analyze impact of data preprocessing: Assess the performance implications of different data preprocessing techniques, such as data normalization or feature extraction, by monitoring resource usage during these processes.
- Experiment with different libraries or frameworks: Compare the performance of different libraries or frameworks (e.g., TensorFlow vs. PyTorch) by monitoring resource usage, execution times, and other metrics while running your code.
I hope this is useful for the Colab community, and we appreciate feedback from everyone.
Enjoy Troubleshooting!